Navigating Big Data: Effective Visualisation Strategies
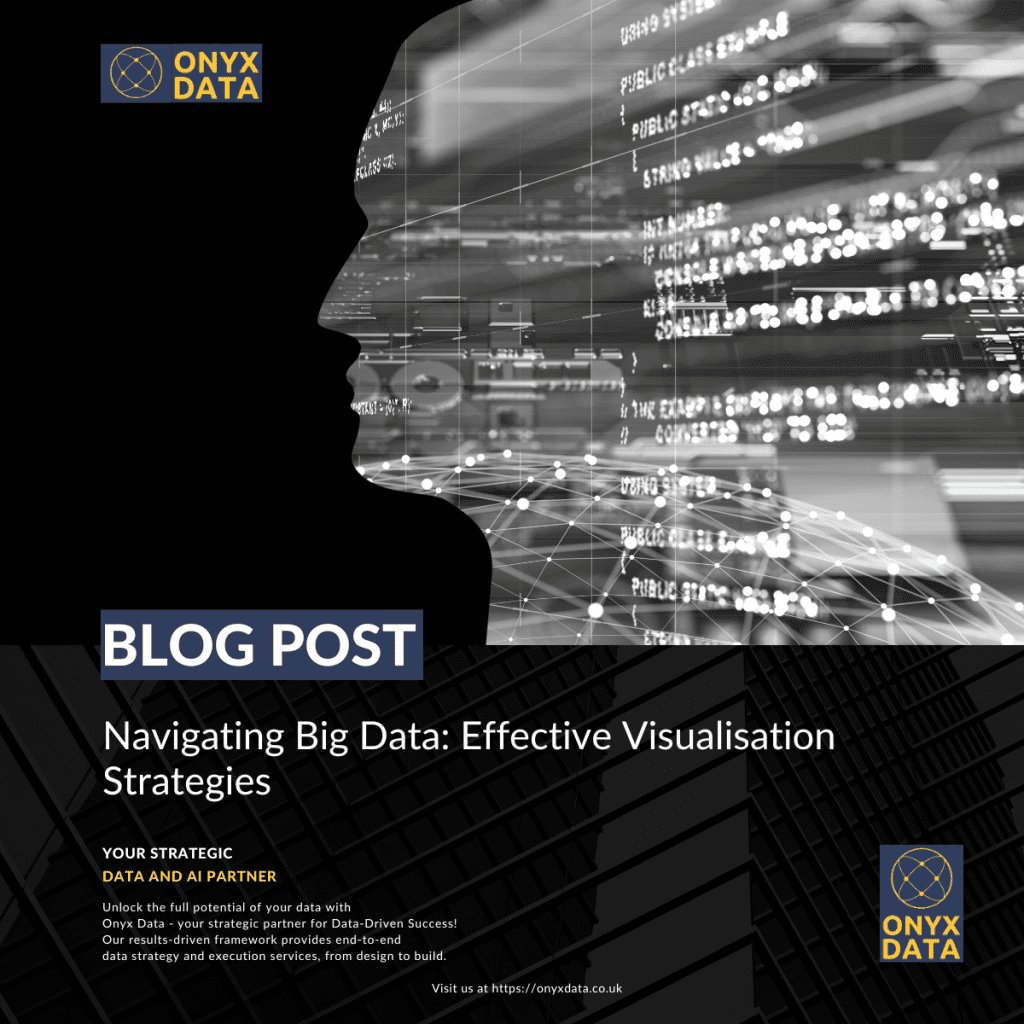

Navigating Big Data: Effective Visualisation Strategies
In the era of information explosion, the analysis and interpretation of large datasets have become integral for businesses, researchers, and analysts.However, comprehending massive amounts of data can be a daunting task. This is where data visualisation comes to the rescue.
By transforming complex data into visual representations, it becomes easier to derive insights, identify patterns, and make informed decisions. In this blog, we’ll delve into the world of large datasets and explore effective strategies for visualising them.
What are some ways to visualise large datasets?

Visualising large datasets requires careful consideration of the data’s nature and the insights you want to extract.
Some popular visualisation methods include
- scatter plots
- line charts
- bar graphs
- heatmaps
- bubble charts
Interactive visualisations like treemaps, sunbursts, and network diagrams offer dynamic exploration.
What is the best dataset for a data visualisation project?
The choice of dataset depends on your goal. Datasets like the “Iris” dataset for beginners or the “Titanic” dataset for intermediate learners are popular choices. For more complex projects, datasets like climate data, financial market data, or social media analytics data can offer rich insights.
What are some interesting public datasets to visualise?
Public datasets, such as those provided by government agencies, can be fascinating to visualise. Examples include crime data, healthcare statistics, census data, and transportation trends. Platforms like Power BI and Google’s Dataset Search provide access to a wide array of such datasets.

What tools can you use to analyse very large datasets?
For analysing very large datasets, tools like Power BI and Apache Spark are invaluable. These frameworks can process and analyse data in parallel across clusters, enabling efficient handling of massive datasets.
What does big data visualisation mean?
- Big Data visualisation involves representing vast and complex datasets visually, often in the form of charts, graphs, and interactive dashboards.
- This practice helps reveal patterns, trends, and correlations that might not be apparent from raw data alone. By presenting data visually, it becomes accessible to a wider audience, aiding decision-making and problem-solving.
In conclusion, the visualisation of large datasets is an essential skill in today’s data-driven world. By choosing appropriate visualisation methods and leveraging the right tools, one can unlock valuable insights from complex datasets. Whether you’re a business analyst seeking trends or a researcher exploring patterns, mastering the art of big data visualisation can significantly enhance your ability to extract meaningful information from overwhelming amounts of data.
- https://www.tableau.com/learn/articles/data-visualization-tips
- https://www.sisense.com/blog/10-useful-ways-visualize-data-examples/
- https://medium.com/@gwynngroupinc/how-to-leverage-data-visualizations-for-an-effective-business-intelligence-strategy-d779565bb50d
- https://www.linkedin.com/pulse/navigating-landscape-data-visualization-tools-selecting-deepak-wagh/
Related Articles