Dashboard vs. Report: What’s Right for You?
In today’s data-driven enterprise, the choice between a dashboard and a report isn’t just stylistic—it’s strategic. As industry leaders, you’re tasked with delivering insights that inform everything from board-level strategy to front-line operations. Selecting the right medium ensures your analytics drive action, not confusion.
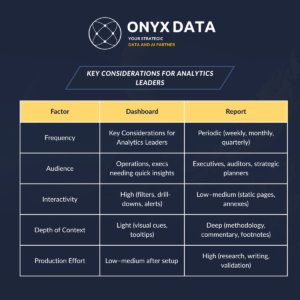
Why the Distinction Matters
-
Dashboards are your real-time command centers. They synthesize metrics into at-a-glance visuals, highlighting trends and anomalies as they unfold.
-
Reports are your comprehensive narratives. They dive deep into context, methodology, and analysis—ideal for strategic reviews, audit trails, and stakeholder buy-in.
Choosing incorrectly risks misalignment: dashboards that overwhelm with static charts, or reports that bury executives in minutiae.
Dashboard Strengths & When to Use Them
-
Real-Time Monitoring
-
Track live KPIs (revenue velocity, site performance, campaign ROI)
-
Surface anomalies immediately (spike in churn, drop in conversion)
-
-
Operational Agility
-
Empower teams with self-service widgets and drill-down filters
-
Integrate alerts into Slack, Teams, or email for instant action
-
-
Executive Overviews
-
High-level scorecards for stand-up meetings or war rooms
-
Visual consistency that reinforces brand and data literacy
-
Ideal for: Daily stand-ups, performance tracking, anomaly detection, executive dashboards.
Report Strengths & When to Use Them
-
In-Depth Analysis
-
Walk through data sources, assumptions, and statistical rigor
-
Provide narrative explanations that link metrics to business outcomes
-
-
Strategic Planning
-
Present quarterly reviews, roadmaps, and investment cases
-
Include appendices for auditability and deep dives
-
-
Regulatory & Compliance
-
Document data lineage, governance controls, and sign-offs
-
Ensure traceability for finance, legal, or external auditors
-
Ideal for: Board presentations, annual reviews, regulatory compliance, investment proposals.
Best Practices: Bridging Dashboards & Reports
-
Hybrid Deliverables
-
Embed mini-dashboards within longer reports for executive summaries.
-
Link from dashboards to full-length reports for users who need context.
-
-
Storytelling with Data
-
Use a clear narrative arc: “Here’s what’s happening → Here’s why → Here’s what to do.”
-
Anchor visuals to strategic objectives (growth, efficiency, risk mitigation).
-
-
Governance & Versioning
-
Maintain a single source of truth—connect both dashboards and reports back to governed data models.
-
Implement version control for reports and snapshot your dashboards at key milestones.
-
-
User Empowerment
-
Train stakeholders on dashboard navigation AND report interpretation.
-
Solicit continuous feedback: refine visuals, adjust report depth.
-
Making the Right Choice
As a Data Analytics Leader & AI Expert, your role is to align analytics delivery with business priorities:
-
If you need speed, agility, and operational alignment, invest in high-performance dashboards.
-
If you require rigor, narrative, and decision justification, build rich, contextual reports.
Often, the most powerful solution is a blended approach—a dashboard-powered executive briefing supported by a detailed report appendix.
Ready to optimize your analytics delivery? At Onyx Data, we architect end-to-end BI frameworks that ensure your dashboards inform and your reports inspire.
Let’s build the right mix for your organization’s goals.
Book a Strategy Session →